
A moving average that reacts faster than a simple one raises a practical question: what exactly does that extra responsiveness change about how a reading should be trusted?
In short
The EMA indicator is an exponential moving average, a trend line that applies greater weight to recent closing prices than to older ones. It smooths price into a single value per bar, with its slope indicating trend direction and its distance from price indicating extension. Common outputs include the EMA value, the percentage delta between price and that value, whether price sits above or below the line, and crossover events between price and the EMA or between two EMAs of different periods.
What Is The EMA Indicator
The EMA indicator, short for exponential moving average, is a trend-following calculation that smooths a series of closing prices into a single line. Unlike a simple average, it assigns progressively less weight to older bars, so the most recent closes have a disproportionate effect on the current value. This makes the EMA indicator turn sooner after a change in direction than an equally weighted average of the same period.
The line is plotted directly on the price chart, one value per bar, and can be calculated on any timeframe from a 1m chart to a weekly one. Traders read it as a rough summary of where price has recently been concentrated, and as a reference level that price can sit above, below, or cross through.
A shorter period, such as 9 or 12, produces a line that hugs price closely and reacts within a few bars. A longer period, such as 50 or 200, produces a line that moves slowly and filters out short-lived fluctuations.
How The EMA Is Calculated
The EMA calculation starts from a seed value, typically the simple moving average of the first period-length window of closes, and then updates recursively. Each new EMA value equals the current close multiplied by a smoothing constant, plus the previous EMA value multiplied by one minus that constant.
The smoothing constant is derived from the period: for a period of length N, it equals 2 divided by (N plus 1). A 12-period EMA uses a constant of roughly 0.1538, meaning the most recent close contributes about 15.4 percent of the new value and the prior EMA carries the remaining weight. A 26-period EMA uses a smaller constant near 0.074, so recent closes matter less per bar and the line moves more slowly.
- Input: a single price series, almost always the closing price of each bar.
- Period: the lookback length, commonly 9, 12, 20, 50, or 200 bars depending on the timeframe and purpose.
- Seed value: the initial average used to start the recursive calculation before weighting takes over.
- Output: one continuous line value per bar, unbounded, in the same units as price.
The default periods of 12 and 26 originate from their use in the MACD indicator’s two underlying EMAs, and 20 or 50 are common defaults for standalone trend reference lines. There is no universal correct period; the choice trades responsiveness against noise. Nothing in the formula fixes the period at any of these values, and running the identical calculation at 8 instead of 12 produces a materially faster line on the same 1H chart.
What The EMA Reading Reflects
The EMA reading reflects the recent center of gravity of closing prices, weighted toward the most current bars. A rising EMA value on a 4H chart indicates that recent closes have, on average, been higher than the closes further back in the period window; a falling EMA indicates the reverse.
Deltaxis also exposes several derived readings built on top of the raw EMA value:
- value: the EMA level on the most recent closed bar, expressed in price units.
- delta: the percentage distance between the latest close and the EMA, positive when price is above the EMA and negative when below.
- price_above: a yes/no state for whether the latest close is above the EMA, regardless of when that position was reached.
- slope: the percentage change in the EMA from the previous bar to the current one, positive when the EMA is rising and negative when it is falling.
- break_bullish: true on the latest bar when the close crosses above the EMA. This is an event, not a state: it fires at the break, not for as long as price stays above the line.
- break_bearish: true on the latest bar when the close crosses below the EMA. Same rule in the other direction.
- cross_up: true on the latest bar when a faster EMA crosses above a slower EMA, for example EMA 9 above EMA 20, or EMA 50 above EMA 200 (golden cross).
- cross_down: true on the latest bar when a faster EMA crosses below a slower EMA, for example EMA 9 below EMA 20, or EMA 50 below EMA 200 (death cross).
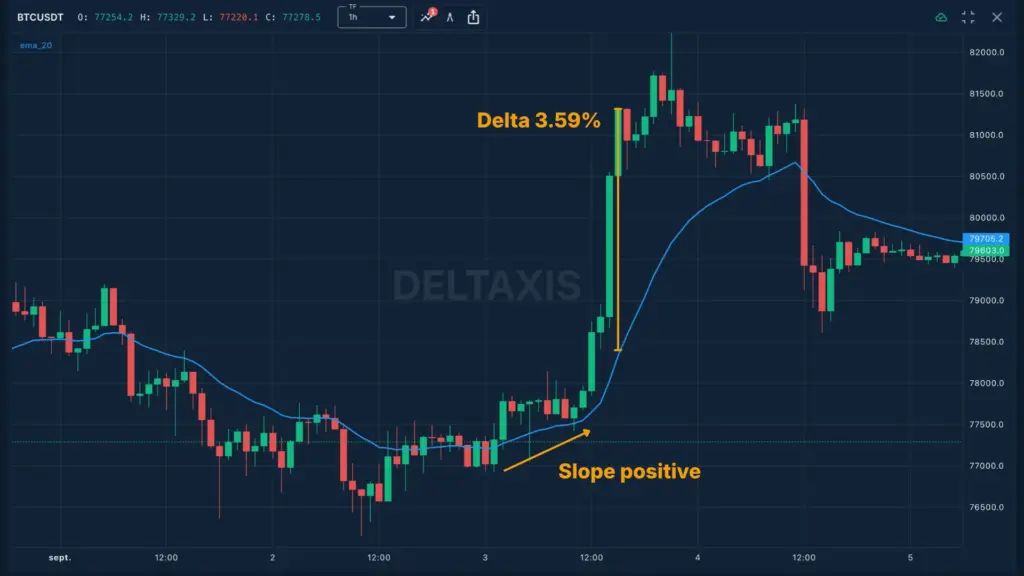
Delta and price_above answer different questions. Delta quantifies how far price has stretched from the average, while price_above only records which side of the line the close currently occupies, with no information about distance or duration.
Reading EMA Crossover Events
Crossover events on the EMA indicator mark the bar where a relationship changes state, not the bars before or after it. Two forms are commonly tracked: a close crossing the EMA line, and one EMA crossing another EMA of a different period.
break_bullish records the bar where the close moves from at or below the EMA to above it; break_bearish records the reverse. Both are single-bar events tied to the most recent close, distinct from price_above, which simply reports current position without regard to whether that position just changed. A cross up between a fast EMA, such as a 12-period, and a slow EMA, such as a 26-period, occurs when the fast line moves from below the slow line to above it; a cross down is the mirror case.
Instruments where a break_bullish event has just occurred on the 1D chart can be enumerated as a distinct market state, useful for narrowing a watchlist to recent transitions rather than established trends. Open the preconfigured screen (free account) covers this specific condition.
Cross up and cross down events between two EMAs behave differently from a single-EMA break, since they depend on the relative speed of two smoothing constants rather than on price alone.
EMA Behavior Across Timeframes
EMA behavior differs substantially by timeframe because the same period length spans a different amount of real time on each chart. A 20-period EMA on the 15m chart covers roughly five hours of trading, while a 20-period EMA on the 1D chart covers twenty days.
| Timeframe | 20-period span | Typical use | Noise sensitivity |
|---|---|---|---|
| 15m | About 5 hours | Short-term entries within a session | High |
| 1H | About 20 hours | Intraday trend reference | Moderate |
| 4H | About 3.3 days | Swing-level trend tracking | Lower |
| 1D | 20 days | Position-level trend context | Lowest |
On the 15m timeframe, slope readings can flip sign several times within a single trading session as short bursts of volume push price through the line repeatedly. On the 4H and 1D timeframes, the same 20-period EMA changes slope less often, and a sustained slope in one direction tends to persist across more bars because each new close carries less individual weight relative to the accumulated history.
A break_bullish event on the 15m chart and a break_bullish event on the 1D chart carry different weight even though the underlying calculation is identical; the 1D event reflects a shift across a much longer accumulated price history.
EMA Compared With A Simple Moving Average
The EMA indicator is often placed next to the simple moving average, its closest structural neighbor, to illustrate what the exponential weighting changes. Both take the same input, a closing price series, and both produce a single trend line per bar; the difference is entirely in how weight is distributed across the lookback window.
| Property | EMA (period 20) | SMA (period 20) |
|---|---|---|
| Weighting | Exponentially decaying | Equal across all 20 bars |
| Reaction to new close | Faster | Slower |
| Sensitivity to old outliers | Fades quickly | Persists until it exits the window |
| Common pairing | Crossover with a second EMA | Crossover with price or another SMA |
The practical trade-off is straightforward: a faster reaction from the EMA indicator means more crossovers and more break events on volatile instruments, while the SMA’s equal weighting produces fewer but sometimes later signals on the same 4H chart.
Limits And Failure Conditions
The EMA indicator fails to describe price usefully under specific, identifiable conditions rather than in some general sense. Two conditions account for most of the mismatch between the line and the price action around it.
The first is range-bound, low-directionality price action. When a pair oscillates within a fixed band on the 1H chart, the EMA slope repeatedly flattens and reverses because the recursive formula responds to every new close, and a sideways sequence of closes produces alternating small positive and negative inputs with no net drift. The result is a line that crosses price frequently without any of those crossings marking a durable directional shift, since the underlying calculation cannot distinguish a genuine trend start from noise inside a range.
The second is a sudden, high-magnitude reversal, common around scheduled data releases or thin-liquidity periods on lower-cap instruments. Because the EMA value is a weighted average of past closes, even a smoothing constant tuned for a short period like 9 needs several bars to pull the line toward a new price level. During that adjustment window, delta can register a large magnitude in the old direction even as price has already reversed, and a break_bullish or break_bearish event generated during this lag reflects the average catching up rather than a fresh directional signal.
A third, more structural limit concerns period mismatch across timeframes. An EMA period selected for the 4H chart, such as 50, does not translate proportionally to the 15m chart; applying the same period there compresses a much shorter span of real time into the calculation, producing a line that reacts to intraday noise the 4H version was never exposed to.
Instruments with low trading volume present a related problem: thin order books allow individual large trades to move the close disproportionately, which the EMA formula then propagates into its recursive value regardless of whether that move reflects broad participation.
Placing The EMA In A Broader View
The EMA indicator describes where price has recently been, weighted toward the newest data, and nothing in its calculation accounts for volume, order book depth, or the funding conditions that shape perpetual futures markets specifically. On instruments where open interest and funding rates drive short-term price behavior, an EMA reading can look identical on paper while the underlying liquidity picture differs sharply between two pairs.
What the EMA indicator does not do is measure momentum independently of price level, which is where an oscillator such as the RSI indicator fills a distinct role: it evaluates the speed and magnitude of recent closes on a bounded 0-100 scale rather than producing a price-level trend line.
Key Terms
- Exponential Moving Average
- A moving average that assigns exponentially decreasing weight to older closing prices, making it more responsive to recent price changes than a simple moving average.
- Simple Moving Average
- A moving average calculated by taking the unweighted arithmetic mean of closing prices over a fixed number of bars, giving equal weight to each one.
- Smoothing Constant
- A weighting factor derived from the chosen period that determines how strongly the most recent closing price influences the current EMA value.
- Crossover
- The event where one line, such as price or a moving average, moves from one side of another line to the other between two consecutive bars.
- Lag
- The delay between a change in underlying price and the corresponding change in a derived indicator value, inherent to any moving average calculation.
Frequently Asked Questions
What does the EMA indicator measure
The EMA indicator measures the exponentially weighted average closing price of an instrument over a chosen period, giving more influence to recent bars than older ones. It functions as a smoothed representation of trend direction rather than a prediction of future price.
How is the EMA indicator different from a simple moving average
The EMA indicator applies a smoothing constant that weights recent closes more heavily, so it turns sooner after a price change than a simple moving average of the same period, which weights every bar in the window equally.
How do EMA crossovers work
An EMA crossover occurs when price closes on the opposite side of the EMA line from the previous bar, or when a faster EMA crosses a slower EMA. Both are state changes recorded at the bar where the cross occurs, not forecasts of continuation.
What is a common mistake when reading EMA slope
A common mistake is treating a flattening EMA slope on a short timeframe, such as the 15m, as a reversal signal, when it often reflects a brief pause inside a larger trend still visible on a higher timeframe like the 4H or 1D.
Why does the EMA lag during sharp reversals
The EMA lags during sharp reversals because its value is a weighted average of past closes; even with recency weighting, a sudden directional change needs several bars before the smoothing constant pulls the line to match the new price level.
Disclaimer: Content published by Deltaxis Academy is provided for educational and informational purposes only. It does not constitute financial or investment advice, a recommendation, or an offer to buy or sell any asset. Trading involves risk. Always conduct your own research and consider your objectives, experience, and risk tolerance before making a decision.