
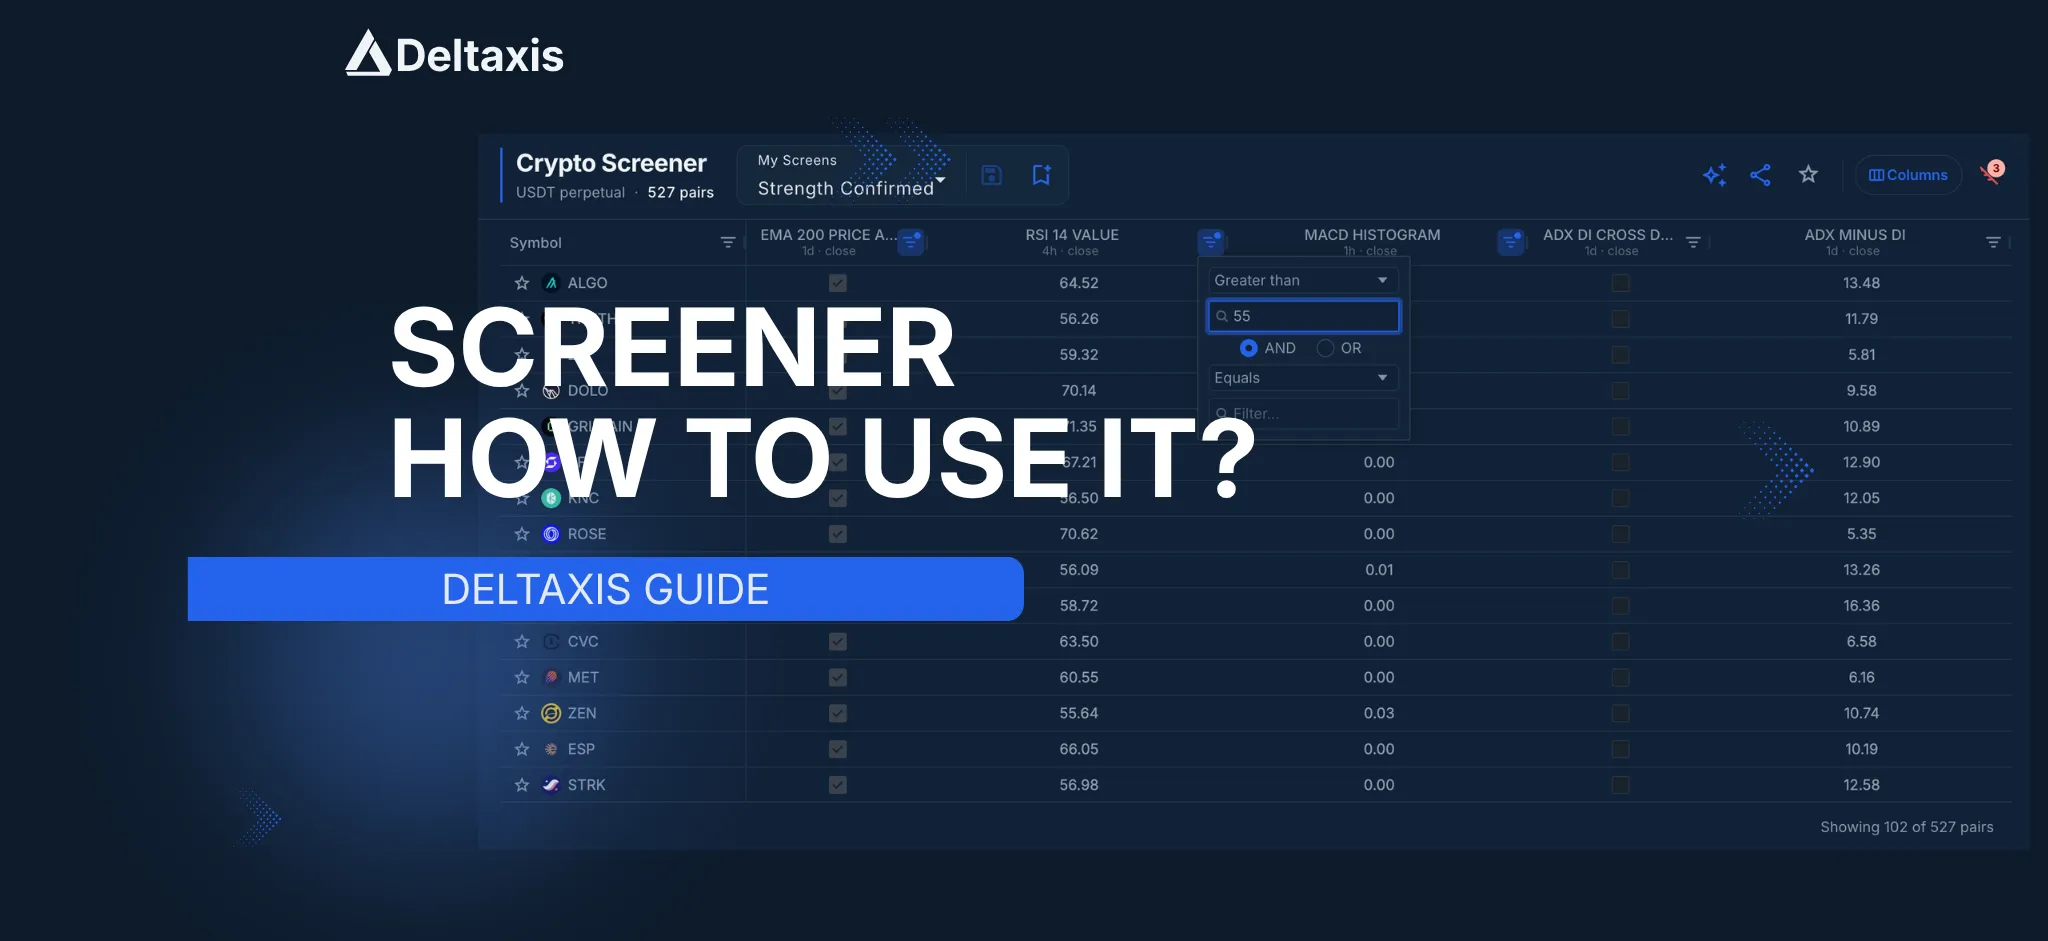
Columns decide what is measured. Filters decide what survives. Saving turns the result into something that can be reloaded and monitored.
In short
A column brings one indicator into the grid at one timeframe, read from the last closed candle or the forming one. Columns stack without limit, so several indicators across several timeframes sit in the same grid. Filters cut it to the pairs matching every condition. Saving names that configuration and is what alerts attach to.
Adding Columns
Everything else operates on columns, so nothing is available until one exists. Open Columns: the catalog is split into Trend, Momentum, Volatility, Volume and Derivatives.
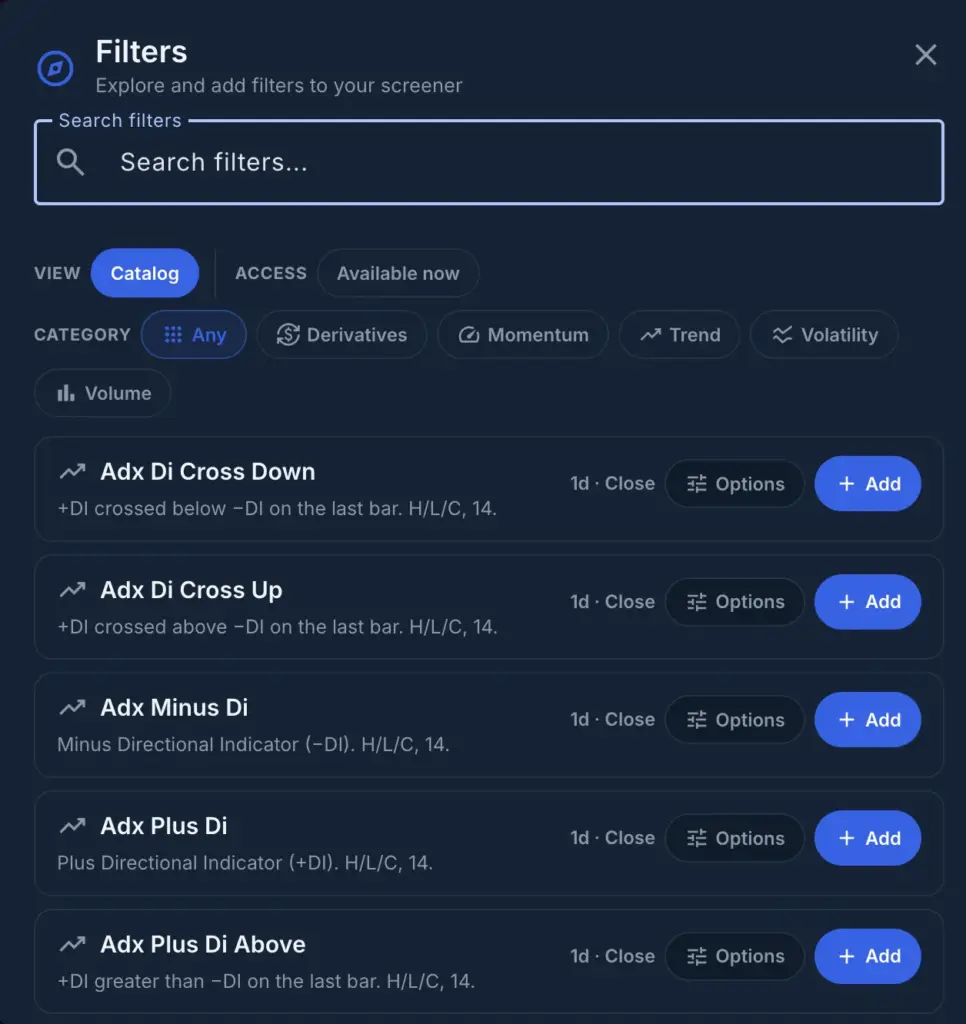
Adding one is three decisions: the indicator, the timeframe, and whether the value is read from the closed candle or the forming one.
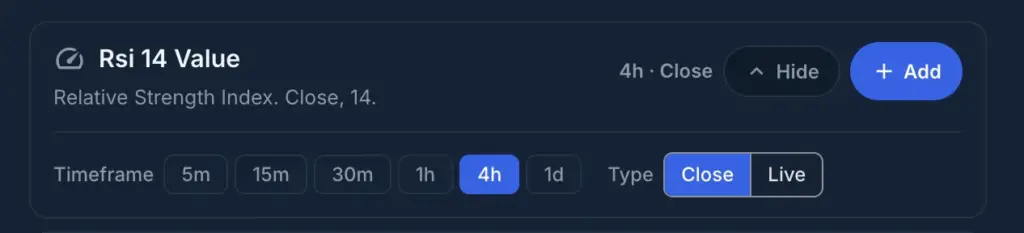
| Setting | Candle used | Between refreshes |
|---|---|---|
| Close | Last closed candle | Fixed until the next close |
| Live | Candle forming now | Recomputed as price moves |
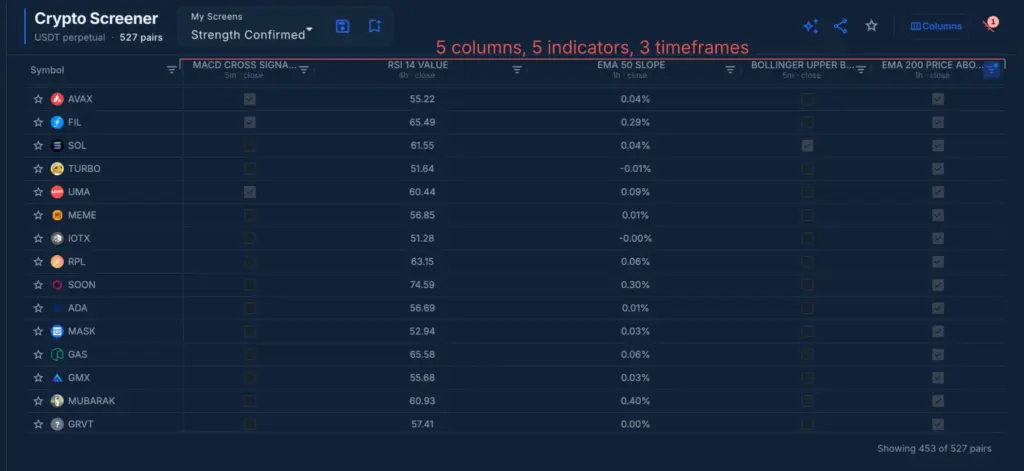
Originals describe what the indicator is doing rather than what it reads: Delta is the change between the last two readings, Slope is a direction, Crosses fires on the event itself.
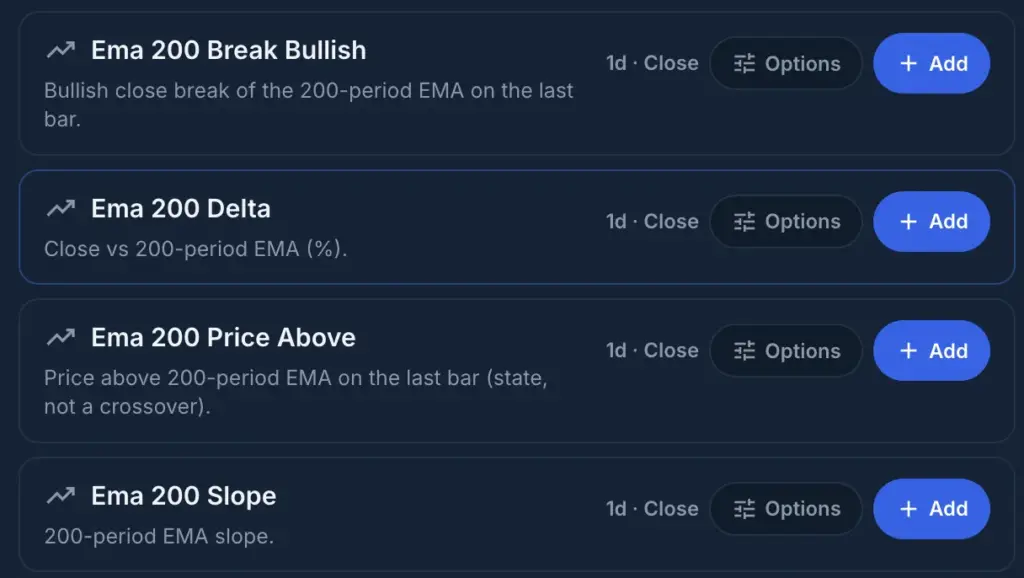
Columns stack without limit. The same indicator at another timeframe is another column, and unrelated indicators at unrelated timeframes sit side by side in the same grid, each filtered on its own terms.
Filtering the Grid
The funnel in a column header opens the condition. On mobile the same control opens as a sheet. Numeric columns take greater than, less than or a range; Crosses, Breaks and Price Above take True or False.
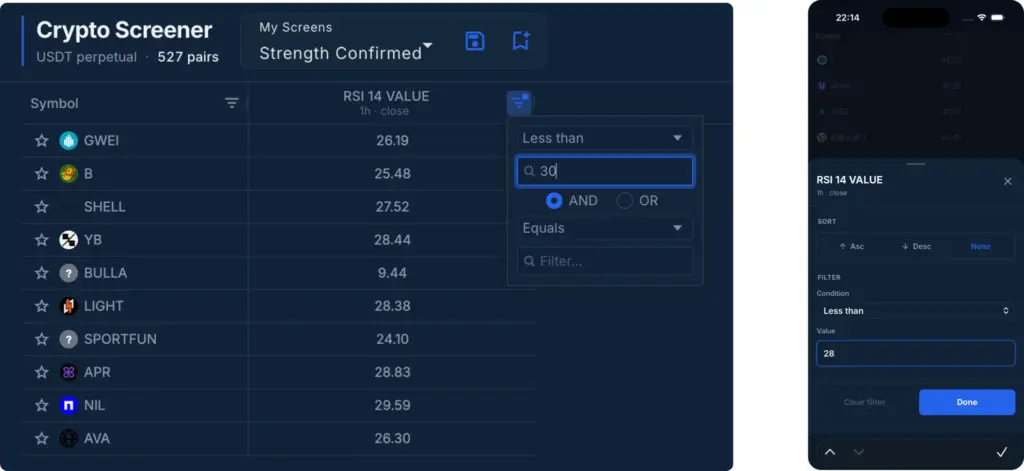
Sorting ranks what already passed and removes nothing. Clear filters drops every condition while keeping the columns, which is the way back from an empty grid.
Reading the Grid
- Pair: pinned left as the grid scrolls sideways.
- Sub-line: the column’s configuration, with open interest decreasing.
- Counter: how many pairs satisfy every active condition.

Price is above the daily 100 EMA, the RSI(14) is below 35 on the 4-hour chart, the Parabolic SAR is positive on the 5-minute chart and open interest has decreased over the last 24 hours.
Checking a Match on the Chart
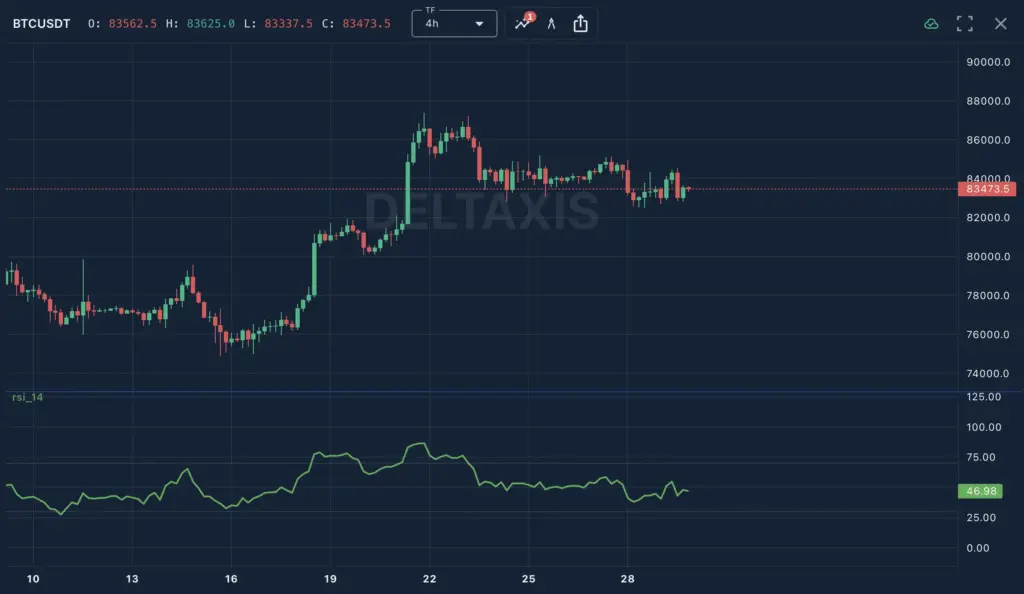
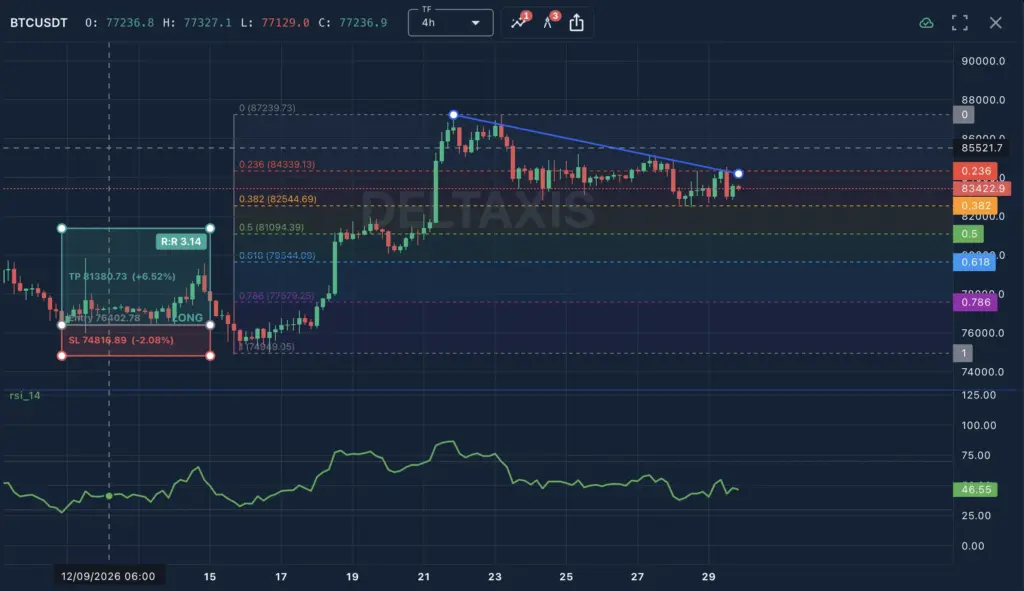
Double-click a row on desktop, tap it on mobile. Indicators overlay on the chart, and the drawing tools cover trend lines, channels, Fibonacci, annotations and long or short zones.
Saving Screens and Alerts
Save the current columns and conditions in My Screens under a name. Update overwrites it after a change; skip it and the saved version keeps the old configuration.
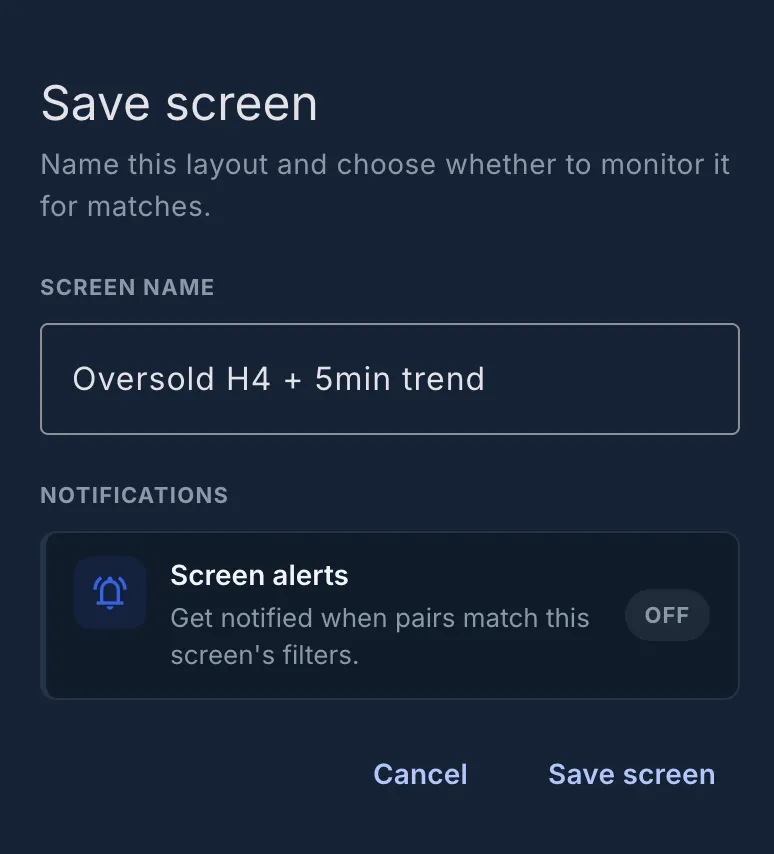
Alerts attach to saved screens, at save time or later from Manage screen. A pair entering the conditions triggers a notification, and matches collect in the Alerts tab.
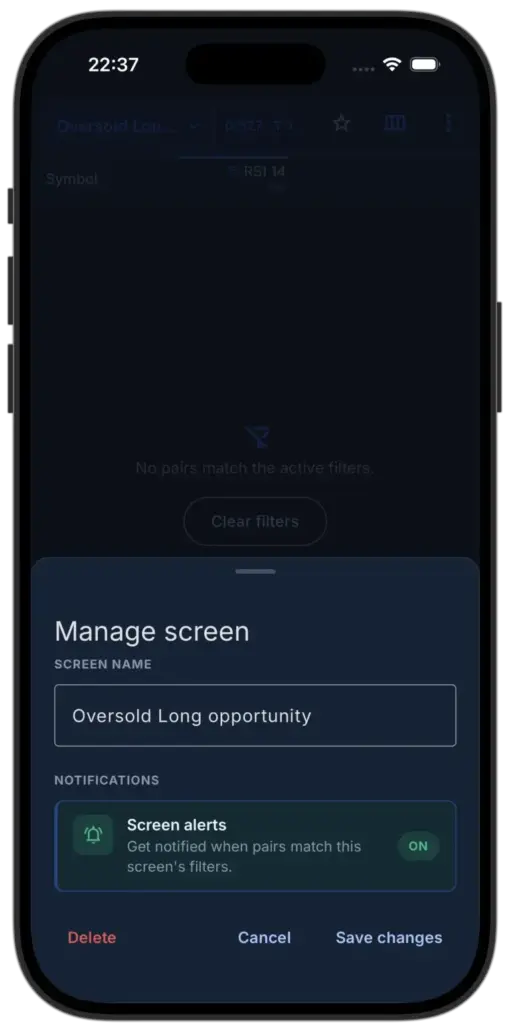
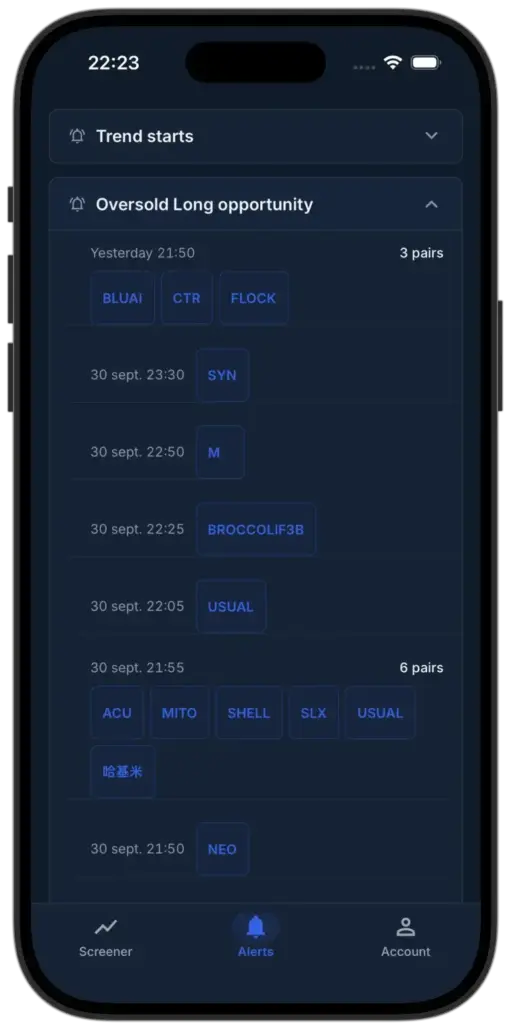
Screens, alerts and the full column catalog are in the Deltaxis screener (free account).
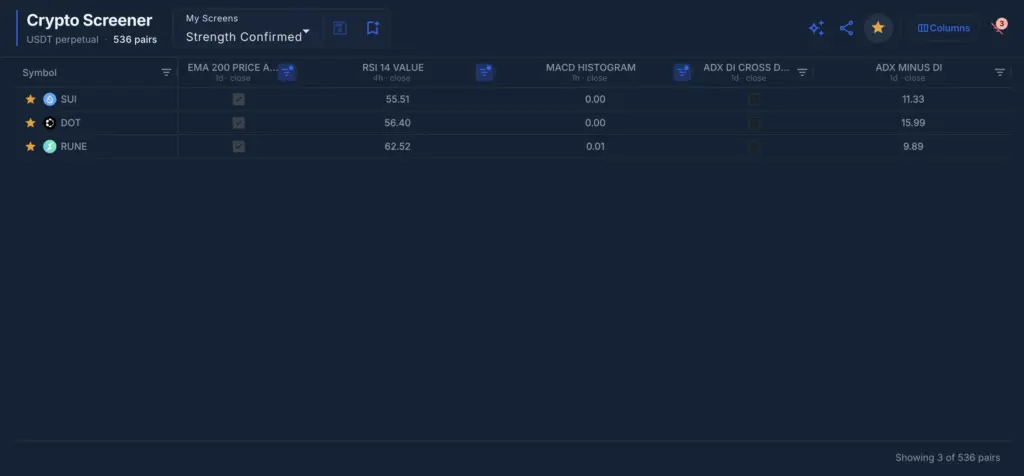
Narrowing to Favorites
Star a pair on desktop, long-press on mobile, then switch on the favorites filter. Columns and conditions are untouched; only the universe they run against shrinks.
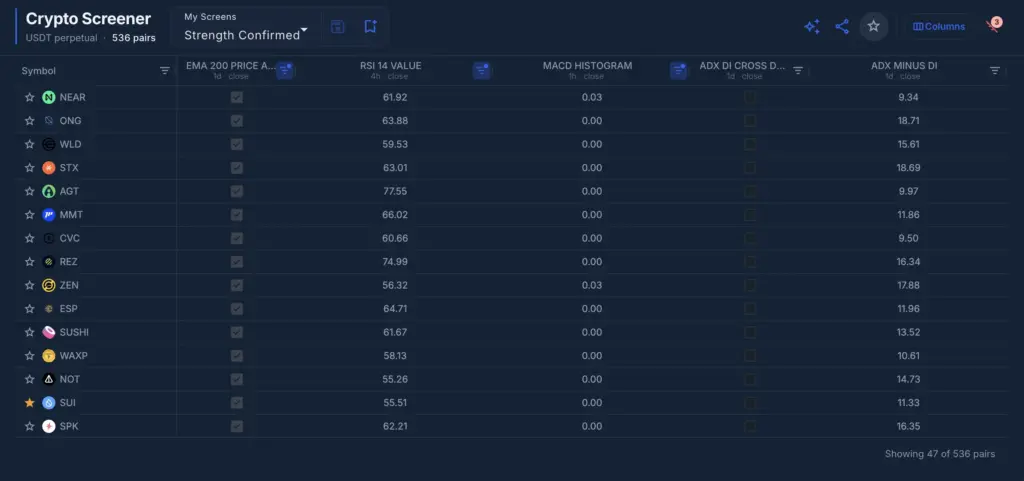
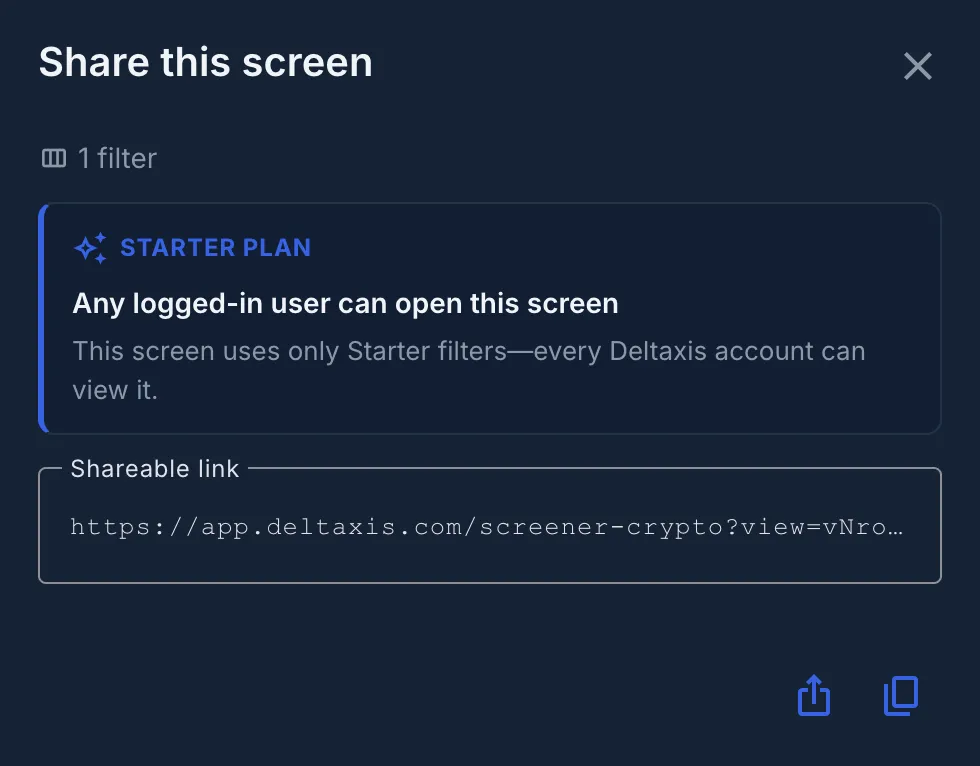
Sharing a Screen
Share produces a link carrying the columns and conditions. The configuration travels, not the results: the screen is re-evaluated against live data when the link opens.
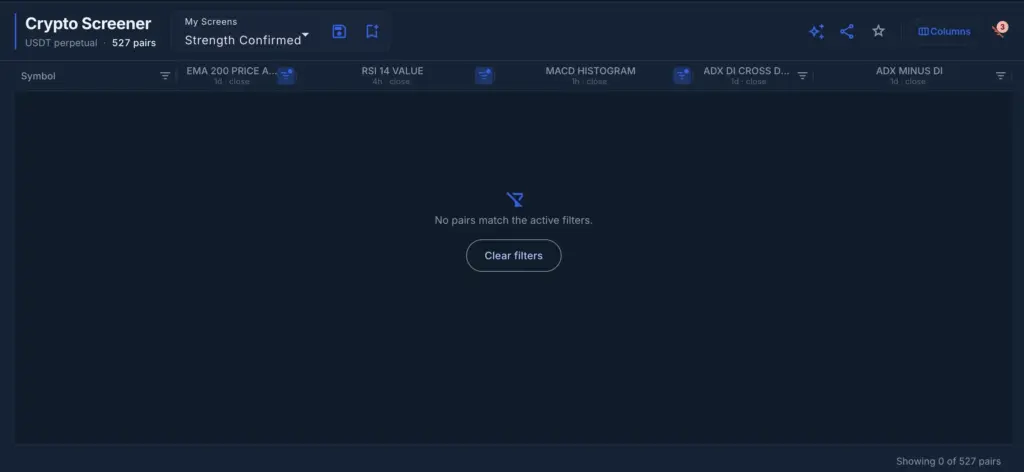
Where Screens Go Wrong
Conditions stack as an intersection. Every filter has to hold at once. Four conditions across four timeframes can describe a state that does not exist right now, and the grid empties. The counter is the diagnostic; Clear filters is the way back.
Live values move. A Live column recomputes on the forming candle, so a pair can satisfy a threshold early and fail it before the close. Close columns are fixed once the candle closes.
One timeframe answers one question. An RSI 1h reading occurs under both a rising and a falling 4h structure, and that column cannot separate the two. A higher-timeframe column is what makes them distinguishable.
Alerts need a saved screen. An alert attaches to a record in My Screens. An unsaved configuration has nothing to attach to, so nothing is monitored.
Terms used in this guide
- Column
- An indicator, a timeframe and a Close or Live setting, computed for every pair.
- Close
- A value read from the last closed candle, fixed until the next close.
- Live
- A value read from the candle forming now, recomputed as price moves.
- Original
- A derived column, such as Delta, Slope, Breaks, Crosses or Price Above, describing behavior rather than level.
- Screen
- A named set of columns and conditions stored in My Screens, with optional alerts.
Disclaimer: Content published by Deltaxis Academy is provided for educational and informational purposes only. It does not constitute financial or investment advice, a recommendation, or an offer to buy or sell any asset. Trading involves risk. Always conduct your own research and consider your objectives, experience, and risk tolerance before making a decision.